Thursday 25 August 2016

SYN Flooding: Detection and Prevention

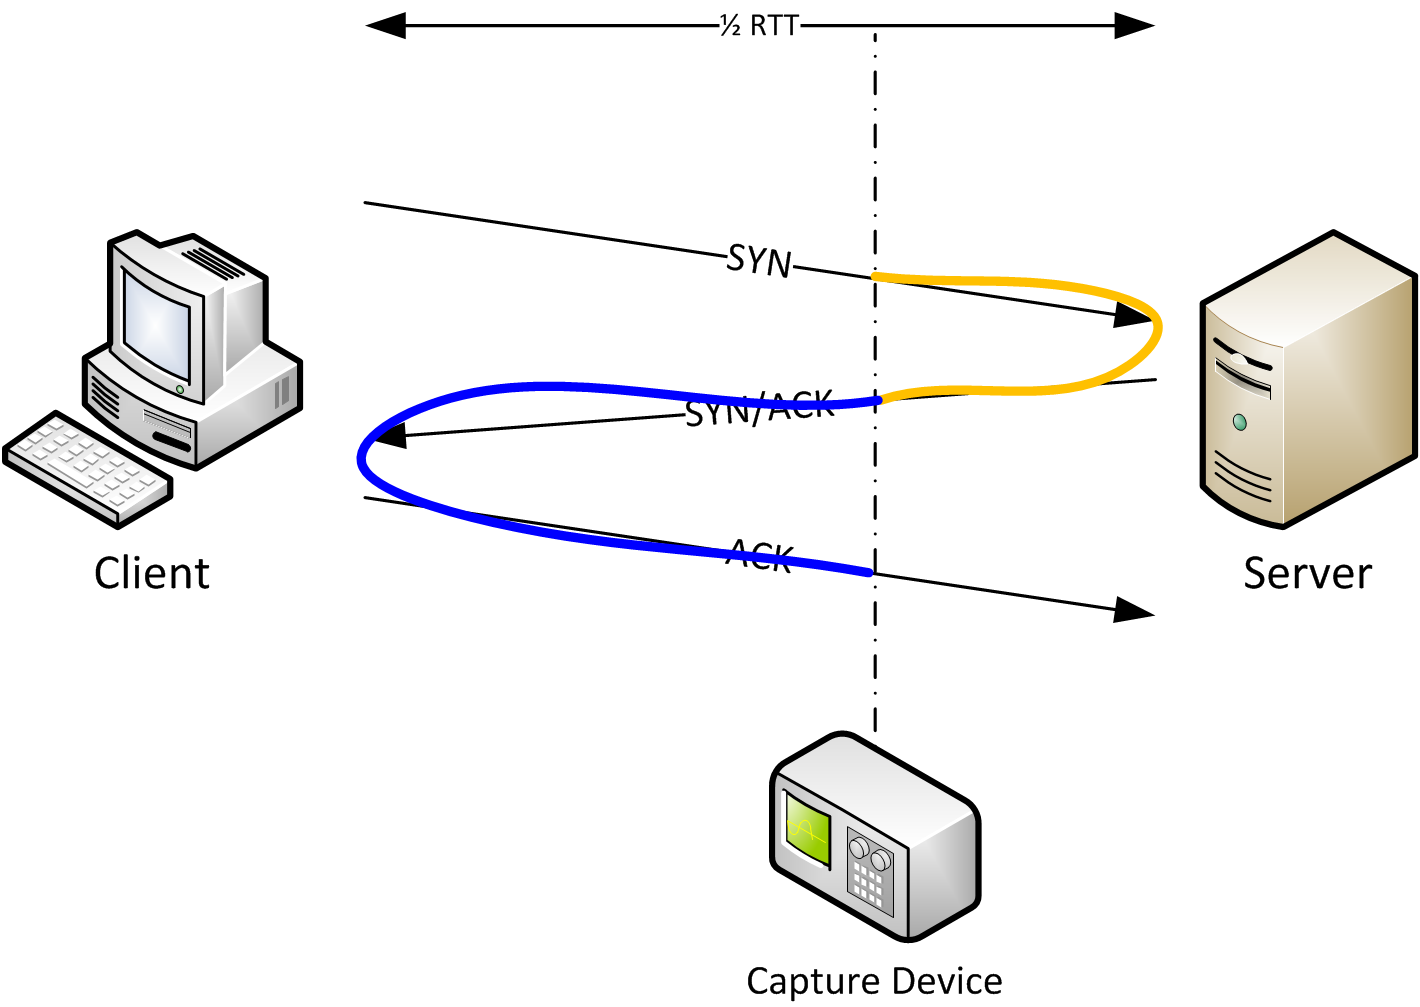
SYN Flooding involves flooding a victim with SYN messages (as part of the three-way handshake) but never actually completing the handshake. Further to this the source address is usually spoofed.

There are numerous methods to help you identify if you are undergoing this style of attack -

If you are running linux you can use the netstat tool to view the relevant connection states:

netstat -tuna | grep :<port> | grep SYN_RECV

For example if you were being attacked on port 80 we would issue:

netstat -tuna | grep :80 | grep SYN_RECV

Or maybe even more helpful:

netstat -tuna | grep :80 | wc -l

or in Windows:

netstat a | findstr ":80" | findstr "SYN_RECIEVED"

or within Wireshark

If the attack appears that it is originating from a single IP address we can simply add a firewall rule in place - such as:

sudo iptables -A INPUT -s 1.2.3.4 -j DROP

otherwise - if the attack appears to be originating from multiple IP's there are a few tweaks we can make to the kernel to help mitigate the attack:

- The net.ipv4.tcp_synack_retries parameter can be changed to 3 (opposed to it's default of 5) to close SYN_RECV states earlier.

- The net.ipv4.tcp_syncookies=1 parameter - which enable SYN cookies.

- Increasing the syn backlog queue size (not always effective dependent on scale of attack) - by setting the followinG: net.ipv4.tcp_max_syn_backlog = 2048

- Reducing the SYN_RECV timeout using the net.ipv4.netfilter.ip_conntrack_tcp_timeout_syn_recv=45 parameter.

We can do all of the above by issuing:

echo net.ipv4.tcp_synack_retries=3 >> /etc/sysctl.conf
echo net.ipv4.tcp_syncookies=1 >> /etc/sysctl.conf
echo net.ipv4.tcp_max_syn_backlog=2048 >> /etc/sysctl.conf
echo net.ipv4.netfilter.ip_conntrack_tcp_timeout_syn_recv=45 >> /etc/sysctl.conf

sysctl -p

TCP: RTT (Round Trip Times) and RTO (Retransmission Timeouts)

A RTT (Round Trip Time) in TCP terms simply defines how long to takes for a client to make a request for example when a sender sends a SYN and then recieve an SYN ACK back from the receiver.

Quite often people will refer to an 'initial RTT' - which is simply the time involved establishing a three way handshake between the two nodes (SYN, SYN ACK, SYN.)

Although it generally not a good idea to capture packets on the client / server side for the following reasons:

- Windows clients frequently have a lot of security software installed that can hinder / alter / block packets.
- Results can be misleading - for example when TCP Segmentation Offloading is being performed.

So instead we will capture by sniffing in between the traffic - although at first glance this does present a slight issue when attempting to attempting to calculate the initial RTT - this is because by the time the network sniffer sees the ACK message from the client it has already travelled some distance and hence it is not possible calculate the overall time - the same applies to the SYN ACK message originating from the server.

Although it is actually pretty easy to get the RTT with some basic math - we simply take the following timings:

- How long it takes the sniffer from when it first see's the SYN origniating from the client until it see's the reply (SYN ACK) from the server.
- How long it takes the snigger from when it first see's the SYN ACK (from the server) until when it first hears the SYN back from the client.

If you put the above two together you will get the initial RTT - the diagram below (courtesy of packet-foo.com) does a very good job of visualising this:


A RTO (Retransmission Timeout): When TCP packets are sent to their destination a retransmission timer begins to count down - if this timer expires before anything is heard back from the destination host the packet(s) are re-transmitted. Now in the event that the re-transmission timer has failed a certain numbers of times a RTO is then imposed - for example the client's TCP stack might hold of sending the packet for 1 second and then attempt to retransmit the packet and if successful gradually send more and more.

If nothing is heard back the client's TCP stack will double the timeout value each time the previous timer expires - for example 3 seconds, 6 seconds, 12 seconds and so on - this process is reffered to as exponential backoff.

One of the initial questions I had was whether the RTO is a static value (i.e. 1s) or whether it varies - and as it turns out it varies (and can do quite significantly) depending on RTT's and various other factors - a much more detailed explanation can be found here: http://unix.stackexchange.com/questions/210367/changing-the-tcp-rto-value-in-linux

Sources:  
https://blog.packet-foo.com/2014/07/determining-tcp-initial-round-trip-time/
http://sgros.blogspot.co.uk/2012/02/calculating-tcp-rto.html

Tuesday 23 August 2016

Decrypting TLS traffic with Wireshark and ssldump

Before Perfect Forward Secrecy became the norm it was fairly easy to decrypt packet captures for TLS traffic within if you possessed the corresponding private key:

This was done by simply exporting the private key (ensuring it's password protected!) and then importing it into Wireshark by going to:

Edit > Preferences > Protocols > SSL > RSA Keys list > Edit > New

and then filling in the relevant server details.

although nowadays when PFS comes into the equation it is slightly more complex - we must now posses the asymmetric session key that is used to encrypt the data.

Fortunately the session key can be captured by setting the following environmental variable within windows:

Name: SSLKEYLOGFILE
Value: C:\SSLKEYLOGFILE.txt

or under Linux:

export SSLKEYLOGFILE=~/SSLKEYLOGFILE.txt

and running a browser such as Chrome or Firefox from the terminal you exported the variable from!

Note: Most Linux distro's will create this file for you - although you must firstly create this file in Windows in order for this to work.

We can then load this file into Wireshark by going to: Edit >> Preferences >> Protocols >> SSL >> and point the '(Pre)-Master-Secret lo filename' at the SSLKEYLOGFILE.txt file.

We can then load our packet capture and you should notice that when viewing the TLS segement there is an option to view the unencrypted data / messages.

In cases where we do not possess a browser or an application is making the request (e.g. a reverse proxy) we can alternatively use a tool called ssldump

ssldump requires the libpcap library (which is bundled with tcpdump.) To install:

yum install ssldump

or apt-get install ssldump

ssldump -k /path/to/key_file.key -i 'interface' -dXnq 'expression'

for example we can capture all communication to and from a specific host on port 443 with:

ssldump -k /path/to/key_file.key -i 'interface' -dXnq 'host 1.2.3.4 and port 443'

I have encountered the following message before after the intiail client handshake:

ERROR: Length mismatch

and had to use tcpdump to caputure the traffic and then feed it into ssldump

ssldump -k /etc/nginx/ssl/wild.key -i 'eth0' -dXnq 'host 1.2.3.4 and port 443'

or we can examine pre-captured traffic (e.g. pcap files) - for example:

sudo ssldump -Ad -k /etc/nginx/ssl/wild.key -r /var/tmp/www-ssl-client.cap

Note: ssldump will only work with RSA ciphers - if you are using DH(E) or ECDHE you will not be able to decrypt the traffic as they private key is not used to encrypt the data and even if you had it you would be unable to decrypt the traffic by simply sniffing it over the wire as the keys are not sent over it. 

This can be a pain when debugging reverse proxy TLS traffic - although there is an (temporary) away around this - by disabling these ciphers on the server (or client) side - we can do this on nginx with something like the following to the server block:

############ Insecure - Testing Only! #############

  ssl_prefer_server_ciphers on;
  ssl_protocols TLSv1 TLSv1.1 TLSv1.2;
  ssl_ciphers "AES128-SHA256:AES128-SHA:AES256-SHA";

############ Insecure - Testing Only! #############

Testing client certificate authentication with curl

A quick snippet useful for testing client certificate authentication against a server:

curl -k https://test.domain.com --key ./client.key --cert ./client.crt -v

or alternatively you can also include the parent CA with:

curl -k https://test.domain.com --key ./client.key --cert ./client.crt --cacert cacert.pem -v

Friday 19 August 2016

Debugging with apache and nginx on RHEL / CentOS

nginx

To enable debug mode on nginx we will need to firstly verify that the '--with-debug' parameter was included at compile time - to check issue:

nginx -V | grep "--with-debug"

If so, you can simply append 'debug' to the relevant error log definition within your server node e.g.

error_log /var/log/nginx/sites/example.com/error.log debug;

and reload the system:

sudo systemctl nginx reload

apache

To enable debugging with apache you will need to find (or add) the 'LogLevel' directive to your httpd.conf file e.g.:

vi /etc/httpd/conf/httpd.conf

and add:

LogLevel debug

Finally reload the service:

sudo systemctl httpd reload

nginx and the default server dilema

Something to look out for when setting up nginx is that there are a fair few misleading default configurations out there - for example when working with SNI's always ensure that you have defined a default server - otherwise the first server block will take this role!

To make things even worse quite often you will see server blocks such as:

server{
   listen 1.2.3.4:80;
   server_name _;
   ...
}

or

server{
   listen 1.2.3.4:80;
   server_name localhost;
   ...
}

Neither of these will act as a default server - rather you must use 'default_server' with the 'listen' directive for example:

server{
   listen 1.2.3.4:80 default_server;
   server_name _;
   ...
}

Setup Mutual (2-way) SSL Authentication with apache / httpd

Client certificates can provide a great way of helping to secure a service that you are unable to (or unpredictably) lock down to a specific source.

For example quite often VPN's and reverse proxies will rely on certificate authentication to provide access to users from the internet - while the service is publicly available (at least on a network level) a valid private key is needed to access the service.

In this scenario we wish to have four main requirements:

A: The remote web service should be authenticated.
B: The remote web service should ensure that we are who we say we are
C: Everything should be encrypted.
D: The client should not have to manually send the client certificate to the server - this should be injected by a reverse proxy on the client side.

A & C can be met using a typical SSL/TLS setup on the remote server.
B can be achieved with the use of client certificate authentication.
D can be achieved by using a reverse proxy (e.g. apache, nginx) on the client side.

Below I have illustrated the high-level design for the 2-way authentication:


Firstly ensure that openssl is installed on the server (almost certainly is in most cases) with:

rpm -qa | grep openssl

The basic process flow is as follows - you (the server administrator) setup your own root CA, you then issue a certificate (and corresponding private key) for a connecting client - when the client connects to your server they will present the public/private key pair they were issued - the server will then validate them and check whether the CA issued them - if successful the user will be granted access to the web service - otherwise the request will fail.

So we should firstly setup our own CA starting by generating our private key:

mkdir /tmp/ssl && cd /tmp/ssl
openssl genrsa -out rootca.key 2048 -nodes

We should now self-sign the certificate:

openssl req -x509 -new -nodes -key rootca.key -sha256 -days 1024 -out rootca.pem

and then ensure that the private key is stored securely somewhere (ideally completely offline) - as if someone get holds of it they will be able to generate certificates freely!

Now the next step is to issue a certificate to our client:

openssl genrsa -out client.key 2048 -nodes

generate a certifcate signing request from it:

openssl req -new -key client.key -out client.csr

and finally sign it with our CA:

openssl x509 -req -in client.csr -CA rootca.pem -CAkey rootca.key -CAcreateserial -out client.crt -days 365 -sha256

rm client.csr

We can now validate our certificate has been issued by our CA with:

openssl verify -verbose -CAfile rootca.pem  client.crt

Now on the server side we will need to configure something like apache or nginx to handle the SSL termination and client certificate authentication (remembering to copy the rootca.pem certificate over) - please refer to here for an example: http://blog.manton.im/2016/04/setting-up-client-ssltls-authnetication.html

Now on the client side we wish to inject the client certificate and its corresponding private key into requests (so the requesting application does not have to do so) - we do this with the 'SSLProxyMachineCertificateFile' directive.

Ensure that the certificate and key is in PEM format and then concatenate them:

cat client.crt client.key > client_bundle.pem

and update your apache vhost configuration with the following addition:

SSLProxyMachineCertificateFile /etc/httpd/ssl/client_bundle.pem

Finally reload apache:

sudo service httpd restart

So to summarize the process flow:

A client from company A makes a request to 'Service1' that is located at Company B's site - the request gets routed through Company A's (the client) reverse proxy: proxy.companya.com and in turn then routes it to company B's proxy: proxy.companyb.com and then finally routes it to the application server running 'Service1'.

For reference I have included the server block from the upstream host (the host that the client connects to):

server {
  listen 10.11.12.13:443 ssl;
  server_name backend.mydomain.com;

  ssl_certificate /etc/nginx/ssl/mykey.pem;
  ssl_certificate_key /etc/nginx/ssl/mykey.key;
  proxy_ssl_certificate /etc/nginx/ssl/client.crt;
  proxy_ssl_certificate_key /etc/nginx/ssl/client.key;
  proxy_ssl_server_name on;

  access_log  /var/log/nginx/backenddom.log  combined;
  error_log  /var/log/nginx/backenddom.error.log debug;

  # Reverse proxy configuration
     location / {
     proxy_pass  https://backend.mydomain.com;
     proxy_set_header        Host            $host;
     proxy_set_header        X-Real-IP       $remote_addr;
     proxy_set_header        X-Forwarded-For $proxy_add_x_forwarded_for;
   }
}


Setting up a reverse proxy on RHEL / CentOS 7

Install apache and the relevant SSL modules with:

yum update && yum install httpd mod_ssl

We should also ensure the 'mod_proxy' module is installed so that we can serve up our backend.

Typically you should not need to install the module as it comes bundled with the standard httpd package on RHEL - although to enable it we must make a few configuration changes to the httpd.conf file:

vi /etc/httpd/conf/httpd.conf

In some cases there might be an include statement to conf.modules.d - so we might need to edit the following file instead:

vi /etc/httpd/conf.modules.d/00-proxy.conf

And ensure the following lines have been uncommented:

LoadModule proxy_module modules/mod_proxy.so
LoadModule proxy_balancer_module modules/mod_proxy_balancer.so
LoadModule proxy_http_module modules/mod_proxy_http.so

Proceed by reloading the server:

sudo systemctl restart httpd

We should create a directory to hold our certificate and key:

mkdir -p /etc/httpd/ssl

then move our public and private key into the newly created directory.

and finally ensure they are locked down with:

chmod -R 400 /etc/httpd/ssl

We can now create our virtual host:

vi /etc/httpd/conf.d/yourdomain.com.conf
chmod 644 /etc/httpd/conf.d/yourdomain.com.conf

And add the following:

<VirtualHost *:443>
ServerName yourdomain.com

ProxyPreserveHost On

ProxyPass / http://localhost:8080/
ProxyPassReverse / http://localhost:8080/

SSLEngine on
SSLCertificateFile /etc/httpd/ssl/ssl_cert.pem
SSLCertificateKeyFile /etc/httpd/ssl/ssl_cert.key

# The location of the HTML files, and access control information
DocumentRoot /var/www/html/yourdomain.com
<Directory /var/www/html/yourdomain.com>
Options -Indexes
Order allow,deny
Allow from all
</Directory>
</VirtualHost>

Note: If your backend is using https you will also need to ensure the SSLProxyEngine directive is set to: 'On'.

Test the configuration with:

apachectl configtest

Also keep in mind that if you have SELinux turned on you may need to either compile the nesasery rules to allow apache to access the local web server running on tcp/8080 (http://blog.manton.im/2016/04/troubleshooting-selinux-on-centos-rhel.html) or disable it (although strongly discouraged.)

Proceed by restarting the server:

sudo systemctl httpd restart

Ensure the appropriate DNS records are setup and attempt to access your site - verifying the request is hitting the server listening on localhost tcp/8080.

Sources:
https://access.redhat.com/documentation/en-US/JBoss_Enterprise_Application_Platform/6/html/Administration_and_Configuration_Guide/Install_the_Mod_proxy_HTTP_Connector_Into_Apache_HTTPD.html

Monday 15 August 2016

Enable verbose AD login / authentication logging with Server 2003/2008/2012

I came across the following article when attempting to troubleshoot some locked out accounts - of course we can enable failed authentication attempts on the DC with group policy - although in some cases source information can be missing - we can enable this by issuing the following command on the DC:

Nltest /DBFlag:2080FFFF

This will enable verbose login information logging - which will be written to:

%windir%\debug\netlogon.log

If this file does not appear shortly after it may be necessary to restart the netlogon service:

net stop netlogon

net start netlogon

When you are finished you can disable the verbose logging with:

Nltest /DBFlag:0x0

and again it may be necessary to restart the netlogon service:

net stop netlogon

net start netlogon

Tuesday 9 August 2016

Identifying / analyzing network congestion with Wireshark

Wireshark can be an invaluable tool when troubleshooting network congestion (or network problems in general!) - below I have outlined several methods that can help narrow down the cause of congestion.

Protocol Breakdown

Quite often network congestion might be caused by a host flooding the network with packets (think broadcast storms, routing loops etc.) An easy way to get an overview of protocol use and potentially identify a protocol that is utilizing the vast majority of bandwidth is by using the 'Protocol Hierarchy' feature that will break down each protocol and provide you with an overview of how much each one is being utilized. This feature can be accessed from: Statistics >> Protocol Hierarchy.

Protocol Errors  

More often than not in a congested network you will likely come across TCP Dup Acks among others - a convenient way to get an overview of all protocol errors is go to: Analyze >> Expert Information - if you are experiencing congestion you will most likely see a high proportion of TCP segement related errors - although there is also plenty of other protocol messages that can look for like ICMP error messages.

IO Graph

One of my favorite methods is the IO Graph - that simply put graphically maps out the throughput / number packets over a given period of time and contrasts it against a specific filter - for example TCP error messages - this can be accessed via Statistics >> IO Graph.


Measuring Latency 

We can also view the latency of the request by right-hand clicking on the output column and selecting column preferences >> Hit the + button and specify something like 'Latency' for the column title and 'Delta Time' for the column type.


Friday 5 August 2016

Wireshark: Capture Filters and Display Filters

Wireshark has two main filter types - a capture filter that is applied on live captures and display filters that are applied on existing (non-live) captures (which provide you with more granular control.)

Display filters provide a way of extracting relevent information from live packet captures and can be applied in one of two ways:

- Either by defining a filter on the actual interface - hence only capturing specific traffic.

- Or against an pre-existing (offline) capture.

Capture filters are comprised of identifiers and qualifiers:

- Identifiers refer to a specific resourse (e.g. (port) 80 or (host) 8.8.8.8

- Qualifiers comprise of three types: type (host, port, net), dir (source / src or destination / dst) and proto (tcp, udp, icmp etc.)

For example if we wanted to look at TCP traffic orginating from 8.8.8.8 to 1.2.3.4 on port 53 we would issue something like:

ip.src == 8.8.8.8 & ip.dst == 1.2.3.4

We are also able to negate results dependent on a specific host or network:

as well as using other conditional statements such as | (or) - for example to get communication (RX and TX) between two hosts we could issue:

(ip.src == 8.8.8.8 & ip.dst == 1.2.3.4) or (ip.src == 1.2.3.4 & ip.dst == 8.8.8.8)

We can also filter dependent on network (and apply negation with the '!' character) - for example if we wanted to filter all traffic from an internal subnet out to the internet we could issue:

ip.src == 10.0.0.0/8 and ip.dst !=192.168.0.0/16 or ip.dst != 10.0.0.0/8 or ip.dst != 172.16.0.0/12

It may also be useful to filter our non unicast traffic somtimes - by removing the multicast and broadcast traffic:

!eth.dst==ff:ff:ff:ff:ff:ff and !ip.dst==224.0.0.0/4

Capture filters are typically less specific and use a slightly different syntax (similar to that of tcpdump.)

For example to monitor traffic (to and from) a specific host we can issue:

host 10.11.12.13

or a specific network:

net 10.0.0.0/24

And capture network from (not to) a specific network:

src net 10.0.0.0/24

We can also monitor TCP applications e.g.:

host 10.11.12.13 and port 80 and not (port 8080 or port 443)

and also refine the capture to only unicast:

not broadcast and not multicast

Thursday 4 August 2016

TCP Retransmission / TCP Dup ACK

TCP by design is considered a reliable protocol since it keeps track of the data it transmits with sequencing and acknowledgements. And hence some times when a network is congested / saturated or there is a faulty component somewhere between the source and destination causing packet loss it is necessary to re-transmit a specific sequence again.

TCP retransmission occurs when the sender sends a TCP segment (which has a specific sequence number associated with it), the sender uses a timer to determine how long it should wait before hearing back (receives an ACK) from the segment it has sent - if the timer elapses before hearing anything back it will send a re-transmit the segment - an example capture is show below:


On the other hand the same situation can occur on the receiver side when the receiver receives a segment with a high sequence number than it is expecting - so the receiver send what is known as a TCP Dup ACK - that simply instructs the sender that it is expecting sequence 7 (not 8 or 9) for example. The receiver will also sometimes send a second TCP Dup ACK that will invoke Fast Restransmission - where the sender will retransmit the segment without waiting for the retransmit timer to expire.

As stated above this is quite often due to congestion on a network - but can also be due to faulty components such as NIC's, faulty or loose cables etc. If possible it is best to narrow down the problem area by checking each hop of the source / destination pathway for any problems - e.g. checking interface statistics for dropped / malformed packets on the router / switch.


Detecting duplicate IP's with Wireshark / Gratuitous ARP

More often than not the majority of mainline operating systems have some form of detection of duplicate IPs - whether it's Windows, Cisco IOS or Android - you are usually presented with some form of user friendly warning.

Although there are times where you might be working with other devices (such as embedded ones) that do not alert you - so instead we must sniff the traffic between the switch and the device itself.

A gratuitous ARP request / reply is an ARP message that (in most cases) is not needed. Although in the event of an IP conflict comes into play. For example a host on the network might send a gratuitous arp request to ensure that no other host(s) respond to it - this request will contain the origin host in it's source and destination address and the destination MAC will be FF:FF:FF:FF:FF:FF.

Typically the host making the request should hear nothing back - although in cases were another host is using that IP address they will send a gratuitous ARP reply to the broadcast address - a real world example can be seen below:


As discussed above many operating systems will send a gratuitous ARP request when a MAC address or IP of a NIC is changed to ensure that there are no conflicts on the network.

Tuesday 2 August 2016

VLAN termination with Intel NICS on Windows 7/8/10/2008/2012

The vast majority of the time Intel NIC's are supported out of the box on Windows operating systems - although the drivers bundled with Windows only expose a small subset of the functionality typically available with the NICs.

A good example of this is the ability to setup VLAN tagging on a subinterface - in order to provide support for this you must firstly install Intel ProSet (and feature called 'Advanced Network Services'):

https://downloadcenter.intel.com/download/25016/Intel-Network-Adapter-Driver-for-Windows-10

When installing ensure that the 'Advanced Network Services' is checked:


Once installed proceed to the interface properties and there should now be a new tab entitled 'VLANs':


Add the relevant VLAN and finally you should see a new network interface adapter appear.